Conclusion first: WQU and QuantConnect solve two different problems. WQU fills in your knowledge system; QuantConnect trains your research workflow. Using either one alone leaves gaps.
Most self-taught quant learners have walked the same crooked path: run a backtest, get a Sharpe of 3.7, get excited, go live, blow up the account. The problem usually isn’t that the strategy was written down — it’s that the person who wrote it can’t articulate why they did it that way.
Look at WQU and QuantConnect side by side, and the boundary is actually quite clear.
WQU: Laying the Foundation
WorldQuant University offers the most value through its complete curriculum structure. Its teaching sequence is a bottom-up line:
Math → Statistics → Python → Financial Data → Machine Learning → Financial Engineering
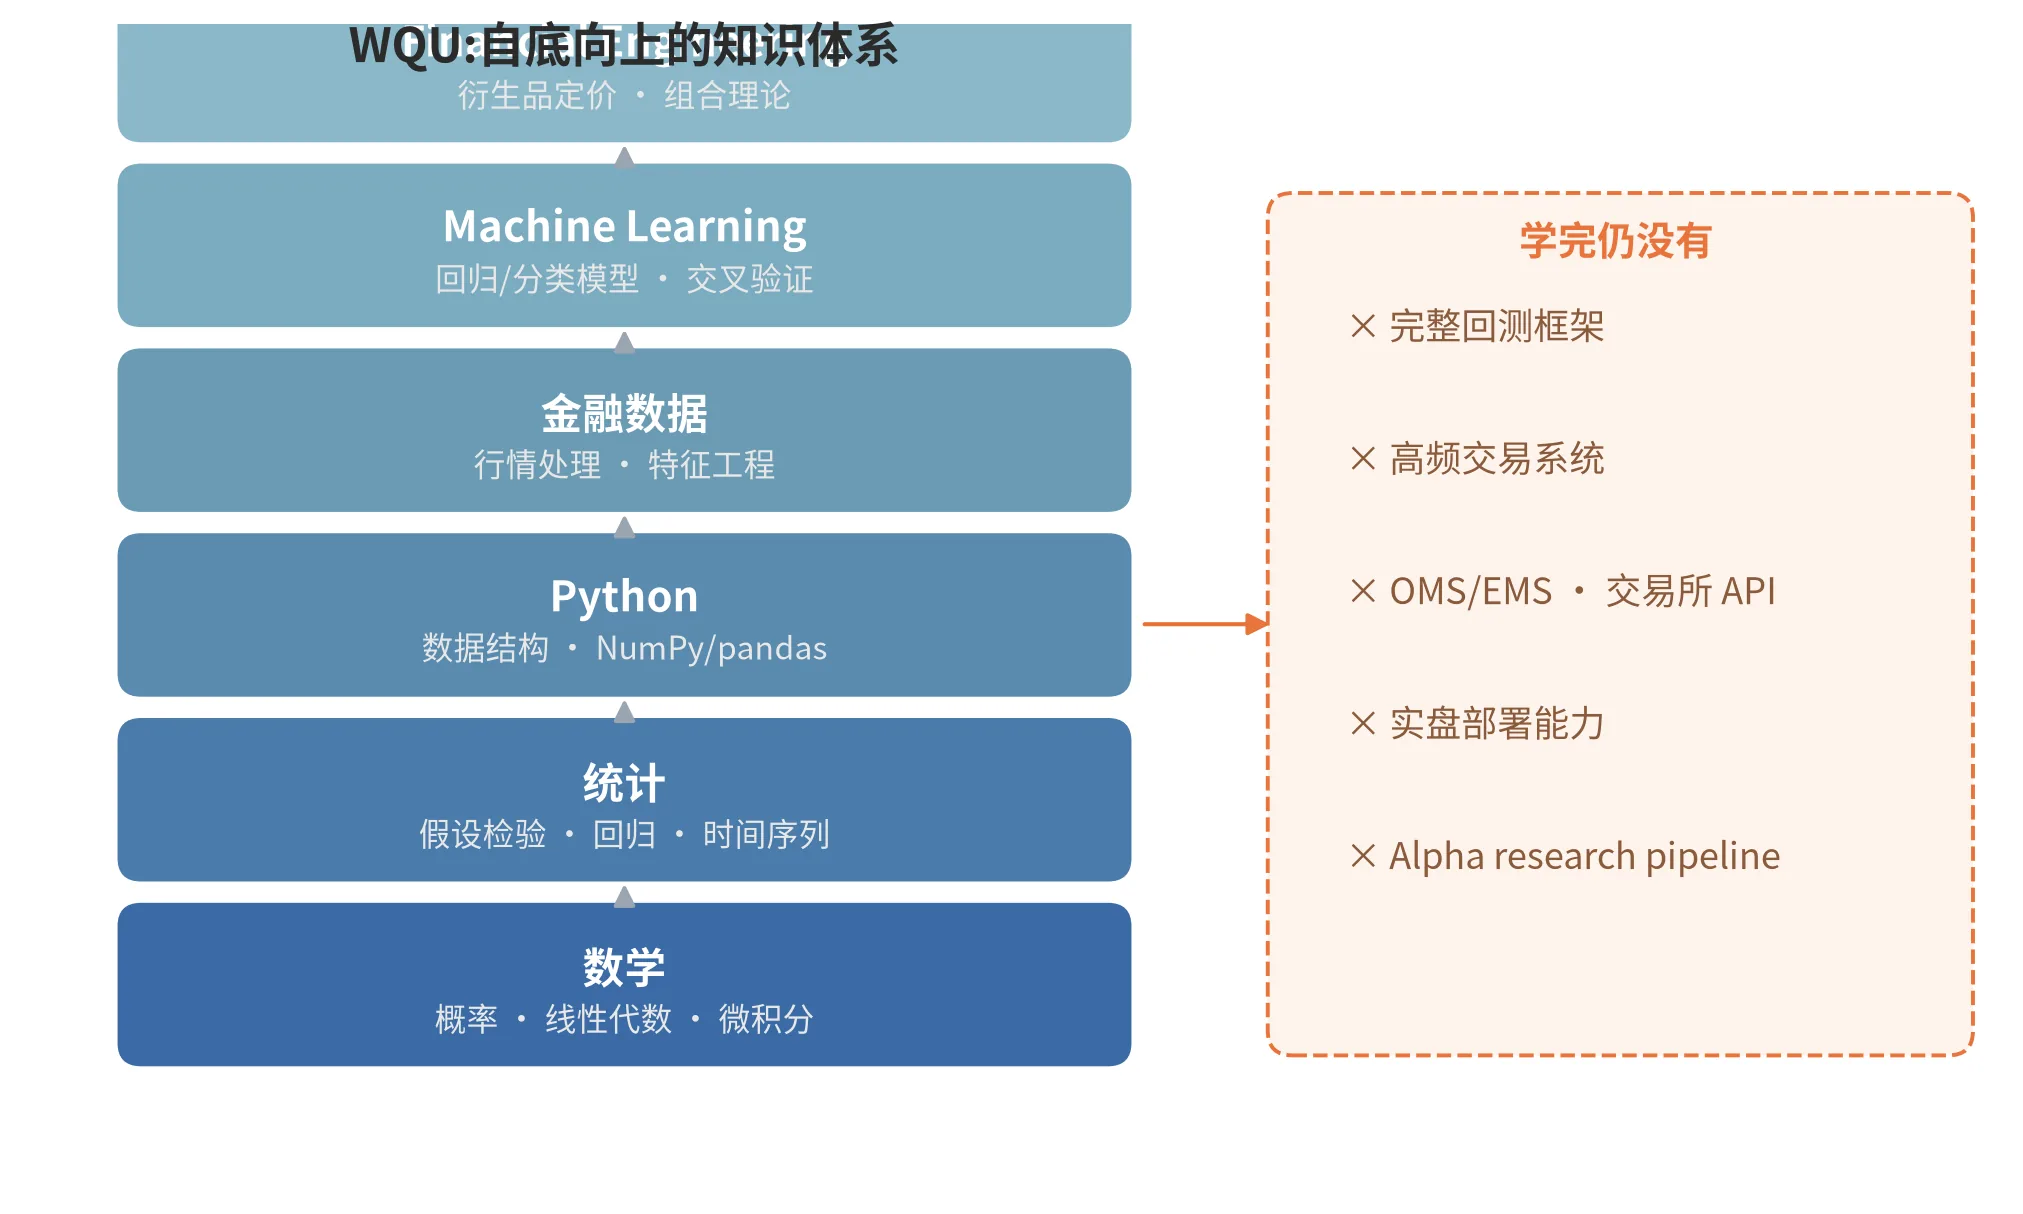
This line is the opposite of fragmented teaching: WQU won’t teach you RSI today, moving averages tomorrow, and some arbitrage strategy the day after.
For people who already have research training but whose computer science and quantitative knowledge foundation is incomplete, this approach fits well.
Its shortcoming is right here too. WQU is a foundational education layer. After finishing it, you still won’t have in hand:
- A complete backtesting framework
- High-frequency trading systems
- OMS/EMS
- Exchange API integration
- Live deployment capabilities
- An Alpha research pipeline
One-sentence positioning: “I want to systematically shore up my quant fundamentals” — choose this.
QuantConnect: Running the Full Process
QuantConnect’s value is completely orthogonal to WQU’s. It lets you actually do Quant Research. The entire pipeline is:
Data → Feature Engineering → Alpha → Portfolio Construction → Risk Management → Execution → Backtest → Live Trading
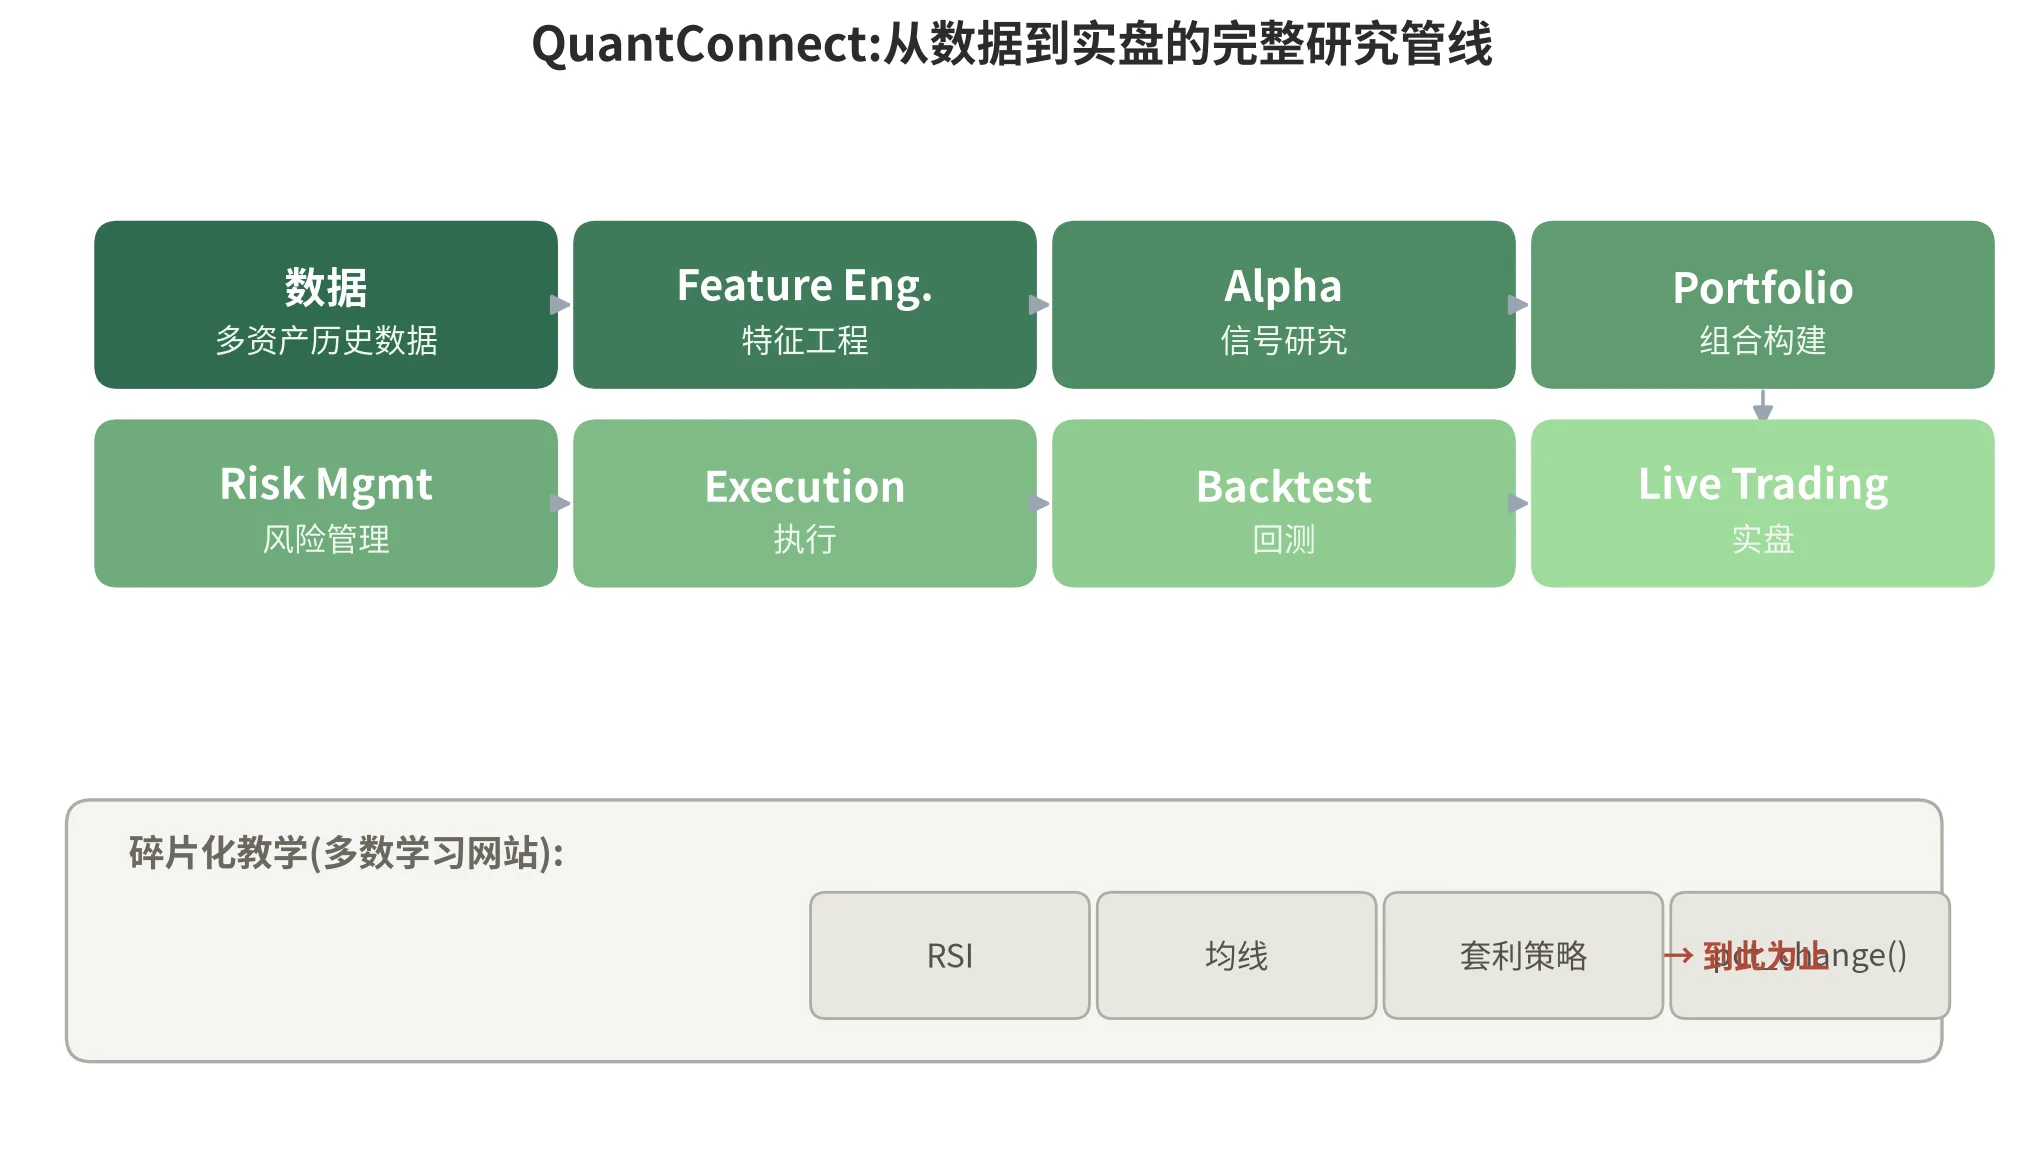
This chain closely resembles real quantitative research work.
Three specific advantages:
① Comprehensive asset coverage. Equity, ETF, Futures, Options, Forex, Crypto — all researchable.
② LEAN engine is open source. The backtesting engine behind it, LEAN, is itself an open-source project. You can pull the code down and read it.
③ From Research to Live. A lot of learning websites stop at df['close'].pct_change() and then announce “Congratulations, you’ve completed quantitative trading.” QuantConnect is much closer to a real research workflow.
Its drawback is precisely that it feels too much like a lab and not enough like a school. Use it long enough and you’ll easily fall into a state: “I can write strategies, but I don’t know why I’m doing what I’m doing.”
For specific common strategy types — RSI sweep, Grid, Momentum, Mean Reversion — combined with backtest validation methods like PBO, DSR, and CSCV, without a statistics foundation to ground you, the outcome is usually:
Backtest → Sharpe 3.7 → Excitement → Overfit → Live blowup
If you want to understand what PBO and DSR are actually computing, both original papers are worth reading directly: Bailey et al.’s “The Probability of Backtest Overfitting”, and Bailey and López de Prado’s “The Deflated Sharpe Ratio”.
How to Combine Them
Only when you stitch the two paths together is the picture complete:
| Gap | How to Fill It |
|---|---|
| Weak statistics and probability foundations | Start with WQU or textbooks first |
| Can write strategies but can’t articulate why | Go back to WQU’s statistics and financial engineering courses |
| Have theory but never touched real data | Run the full research → backtest → live workflow on QuantConnect |
QuantConnect is best used alongside WQU or textbooks: the former gives you feel, the latter gives you judgment.
Judgment, in operational terms, comes down to one thing: before putting any strategy live, first answer what the PBO is. If you can’t answer that, you’re not ready for live trading yet.