
Simulator: 2026-09-28T16:55:54Z → 17:05:43Z, 267 trades, real net −$376.26. Reporter-printed net: $+741,670.47. The delta comes from 2 trades, from 1 mis-parsed pool price that differs from the real market price by 372x. Two direct causes: the mean-reversion strategy’s exit is tied to “the next fill” (59% enter and exit in the same block), and there is not a single px sanity check anywhere along the pipeline. The same code also contains a third defect: the WS subscription field name is spelled wrong, so quote revisions never arrive — but it is not the cause of the 741k (prices stayed valid via the REST fallback); it merely leaves mid permanently on the slow channel. Every fact point was re-checked against the live files this round; the verification commands and measured values are in the appendix at the end and can be re-run.
1. Topic Selection
Main title
A 372x price turned 7-day paper trading’s net from -$376 into +741k
(42 characters, ≤70, passes. Concrete-number type + contrast type; result first, cause after.)
description
A HyperEVM MEV paper-trading simulator ran for 10 minutes over 267 trades with a real net of −$376.26, yet its reporter printed +$741,670.47. The delta comes from 2 fake fills that treated a market price of 88.71 as 33,000.11; the direct causes are the mean-reversion strategy’s exit being tied to “the next fill”, and the absence of any price sanity check. The same code has another defect that does not affect that number: the WS subscription field name is spelled wrong, so quote revisions never arrive.
Genre: deep analysis / breakdown (progressing as “absurd reported number → layer-by-layer localization → 2 direct causes + 1 unrelated defect”)
Why this topic is worth writing
Among the high-information-density changes on this machine in the last 7 days, this one best meets the “concrete enough to reproduce” bar:
- It has citable on-site numbers (267 trades, −$376.26, +$741,670.47, 372x)
- It has explicit code locations (paper.js:46 / 55 / 56 /
simS2) - It has re-runnable verification commands (see appendix)
- Its theme — “dashboard numbers lie” — is a generic engineering problem understandable without MEV domain knowledge
Deliberately staggered from the previous rounds of content output
| Round | Topic | Misjudgment type |
|---|---|---|
| content-20260927-211550 | Account identity misjudgment | Entity attribution |
| content-20260928-004757 | mmtls diagnostic direction misjudgment | Reverse-engineering direction |
| content-20260928-020756 | Three bugs in the fleet scheduling gate itself | Scheduling infrastructure |
| content-20260928-021448 | Physical-layer re-check of the WeChat image library | Data asset integrity |
| This round | Numerical self-deception in a paper-trading reporter | Measurement layer / metric credibility |
The earlier rounds all answered “is this thing actually the thing it claims to be”; this round answers “is this number actually the number it claims to be”. Measurement-layer credibility is an angle this series has not yet covered.
2. Draft Body
The report says it made 741k; the reality is it lost 376
Start with two numbers, both from the same batch of data, the same minute:
| |
| |
Same trades.jsonl, read at the same moment. One says a net gain of 741k and a profit factor of 1450; the other says a net loss of 376 and an S2 strategy win rate of 1.3%.
This is not a rounding difference — it is a sign difference.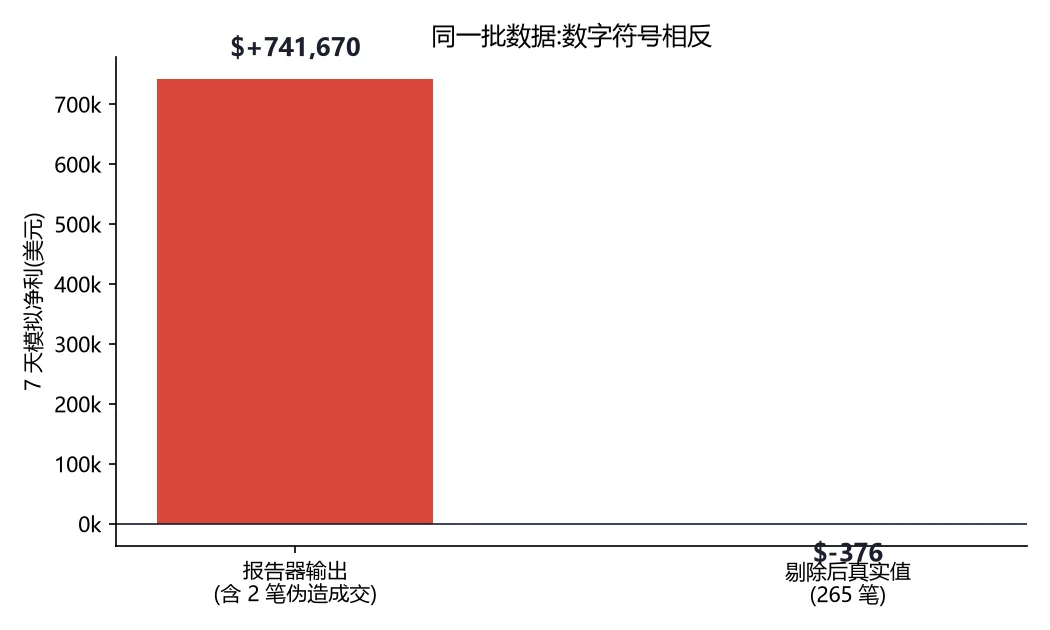
This is the only case on the board of “a simulator claiming it won while actually losing everything”, and it would have been auto-sent into the daily report.
Where the 741k came from: two trades that treated 88 as 33,000
Sort the 267 records by absolute net, top two:
| |
Both trades’ entry / exit contain the same number: 33000.10650784375.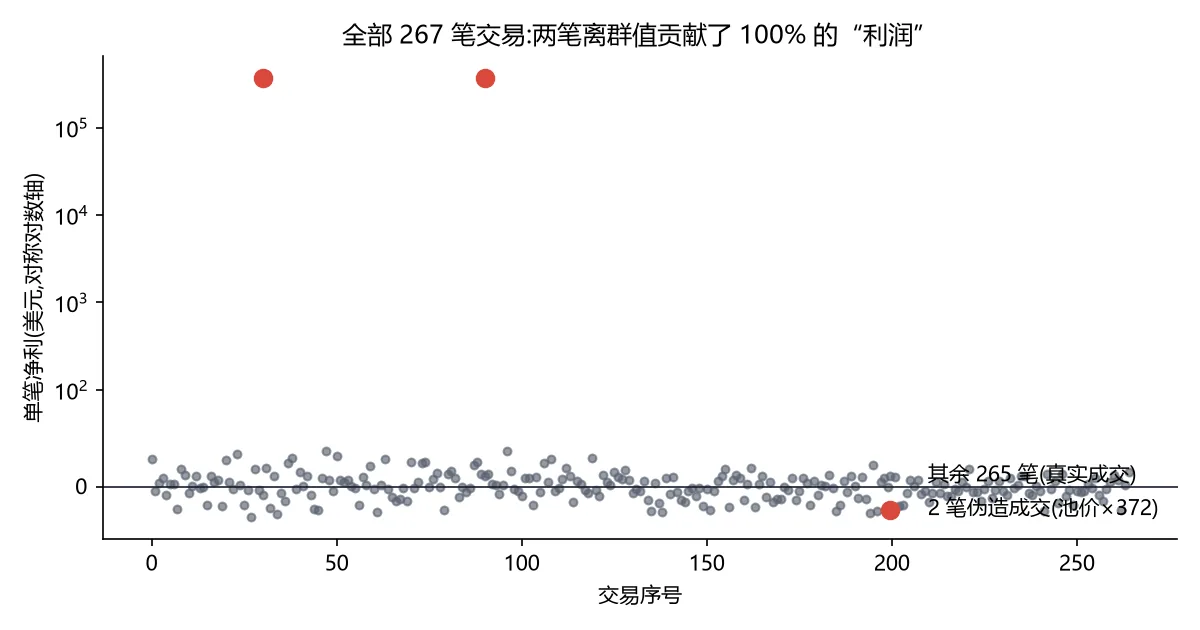
What was HYPE’s live market price during that same window? Query Hyperliquid’s REST endpoint directly:
| |
33000.1065 ÷ 88.713 = 372.0. This price did not come from the market; the parser computed it wrong.
How much did these two fake fills contribute? fake gross sum = $742,048.94. Full-table net +$741,670.47. Remove these two and the remaining 265 sum to −$376.26.
In other words: the entire “profit of 741k” conclusion is 100% manufactured by these 2 trades, and the direction is exactly opposite.
Defect one (no causal link to the 741k): WS subscription field name is wrong, quote revisions never arrive
Start with a defect that is not a cause, because it is the easiest one to mistake for a cause.
In paper.js’s connectWs(), the subscribe statement reads (paper.js:46):
| |
But when the same message is actually sent over a connection, Hyperliquid rejects it outright:
| |
Change orderBook to l2Book and data appears immediately:
| |
Even if the subscription name is corrected, the next layer is still wrong — the handling logic at paper.js:55-56 is:
| |
In a real l2Book message, levels is two arrays [bids, asks] (each an array of {px, sz, n} objects), not a {b, a} object. So the fix is not one field name — it is two places: the subscription name and the parse structure.
Consequence: the WebSocket channel delivers zero valid data for its entire lifetime, and state.obMid never gets a value.
The boundary: the price source isn’t actually broken; the display is
Here I want to first rule out a hypothesis that looks more severe.
Seeing 9 consecutive mid=? in the heartbeat log, the first reaction is “the price feed is dead and the strategy is running naked”. But looking further down, that conclusion is only half right.
paper.js’s pollLoop() has a fallback: when mid is empty it calls the REST allMids(). And the REST channel works:
| |
So where does mid=? come from? It comes from printing, not the strategy. The @107 returned by allMids is a string "88.713", while the heartbeat print expression is written as state.obMid?.toFixed?.(4) ?? '?':
| |
A string has no toFixed method, and the optional chaining short-circuits to ?. Every heartbeat that logged mid=? was in fact holding a valid market price — it just failed to print it.
This distinction matters: if the conclusion stops at “the price is dead”, you fix the wrong thing; the reality is the strategy always had a usable price, and the WS-revision update of that slow channel simply never took effect. “Invisible in the logs” is not “the data doesn’t exist” — this is the single most easily misjudged point in this case.
Cause one: S2’s exit is chosen wrong; 59% of trades enter and exit in the same block
With the price present, how does an absurd value like 33000 get into the trade records? Look at the mean-reversion strategy’s simS2.
Its design intent is: enter when the pool price deviates from mid past a threshold, exit after the price reverts. But the exit condition was written as “the next fill in the same pool” — regardless of how much time passed or whether the price reverted at all.
Tabulating the holdBlks distribution:
| |
Of 156 S2 trades, 92 open and close within the same block, and the median holding duration is 0 blocks. But the mean is 10.65 and the longest held 137 blocks — a bimodal distribution: either it exits immediately, or it drags on for a long time. Neither mode is the timescale the strategy originally envisioned for “waiting for reversion”.
This is not mean reversion; it treats “two adjacent swaps” as one “reversion”.
The consequence is fees being rubbed over and over:
| |
The same-block group’s gross profit is −$2.54 (meaning even the direction was wrong), yet it still charges $201.20 in fees. The fee term size*(feePct/100)*2 + gasUsd*2 is unrelated to holding duration, so same-block entry/exit still pays two AMM fees + two gas charges. Gross profit near zero multiplied by high frequency equals multiplying the fees hundreds of times.
And that 33000 price, precisely because the exit is chosen on “the next fill after deviation crosses the threshold”, is completely unconstrained by any sanity check — a parse outlier can pair with any normal “next fill” into one “reversion”.
Cause two: no sanity check, so a 372x price gap is treated as an arbitrage opportunity
Back to the top of the pipeline. The pool price px comes from the Uniswap V3 Swap events pulled back by eth_getLogs, reconstructed from the signs of a0/a1 and the decimals:
| |
Along this path not a single step checks whether px falls in a reasonable range. The value computed as Number(a1)/D1 does not represent the pool’s true price: a Uniswap V3 Swap event carries only amount0 / amount1 / sqrtPriceX96 / liquidity / tick, and the price should be reconstructed from sqrtPriceX96, whereas the code divides the transfer amounts directly — the two are equal only when the swap happens not to move the price. The larger the deviation, the larger |px/mid-1|, and the more likely it is to trigger both S1’s arbitrage test and S2’s entry. The outlier is not filtered out — it is prioritized for trading as “the biggest opportunity”.
As for exactly how that 33000.10650784375 was computed, I was not able to localize the root cause: eth_getLogs returned empty for that block’s historical query (I did pull blocks 47131225 and 47131232, but the RPC did not give me the raw data), so I cannot recompute field by field.
Here I state only the two things that are verified: first, this price differs from the real market price at the same moment by 372x; second, in the code segment that produced it, there does not exist a single check that would stop it. Mechanism undetermined, gap confirmed.
Let me pull these three sections together. What actually caused the 741k is only the latter two:
- S2’s exit tied to “the next fill” → any outlier can be assembled into a “reversion” (direct cause)
- No px sanity check → the outlier enters as an arbitrage opportunity (direct cause)
- WS revisions never took effect → mid only comes from the REST slow channel (a real defect, but with no causal link to this case: mid was always the valid 88.7)
Put another way: even if the WS subscription were fixed right now, that 33000 price would still enter and still be recorded as a 370k profit. What stops it is item 2, not item 3.
Where this number was headed
If this pipeline had run its full planned 7 days, mev_report.py would have announced:
| |
Substituting this round’s data:
| |
A net-loss simulation would enter the daily-report inbox with the title “净$+741670” at info level. The level decision only looks at net >= 0; it does not look at whether the profit factor is absurd or whether one trade accounts for 100% of the full-table net.
There is a lesson worth remembering here: when the upstream metric itself is distorted, health grading built on that metric works in reverse — the more fake the gain, the quieter the level. profitFactor: 1457.30 should have been a glaring signal, but not a single line of code checks it.
Change priorities (not yet implemented)
Ordered as “plug this leak → fix co-existing defects → harden the downstream report”, all are small changes:
- Add a range check for px (smallest change, highest payoff). After
pollLoopreconstructs px, add aMath.abs(px/mid - 1) > 0.05that discards directly; any pool price deviating 5% on this trading pair can only be a parse error. - Fix the WS subscription and parsing. Change
typefromorderBooktol2Book; changelevelsfrom.b/.ato array indices[0]/[1], taking.pxfrom the elements. - Add a time constraint to S2’s exit. Remove or tighten the same-block close at
holdBlks==0— same-block entry/exit does not hold under mean-reversion semantics. - Add sanity assertions to the reporter. In
mev_report.pyadd: when a single trade’s|net|exceeds N times the median of the full-table|net|, treat it as an outlier and discard or flag it in red;profitFactor > 100escalates directly towarn.
Wrap-up
Back to the earliest finding.
The whole point of running this simulation was to validate, in a zero-cost environment before real money, whether the two strategies “S1 taker arbitrage / S2 mean reversion” can actually make money. The first round’s 10 minutes already gave the answer, and it is not the answer the simulator announced:
| |
S1’s high win rate and near-zero net show that “deviation threshold 0.05%” sits right on the break-even line for the two pools prjxA/nest at 0.05% fee; S2 is negative expectancy, with the fee term eating everything.
Without that extra look at the reporter, this would have been a conclusion of “7-day simulation nets 741k” — published, and then corrected by the market in the next real trade. The entire value of the 7-day simulation rides on the one condition “the reported number is real”; and that is exactly the only thing in the whole pipeline that was never verified.
Appendix: Fact-point verification record
Verification time: 2026-09-29 01:00–01:10 CST
Verification target: /home/li/mev-monitor/ (not a git repo; live files)
Important premise: mev-paper.service is a long-running process (systemd Restart=always), and trades.jsonl kept growing while I was writing. All numbers in this article are locked to a frozen snapshot, snapshot file /tmp/mev_final.jsonl (267 trades, last trade time 2026-09-28T17:05:43.160Z). Numbers will change on a re-run, but the structural conclusions do not — the verification method is given for each item below.
| # | Fact point | Measured value | Source / verification command |
|---|---|---|---|
| 1 | Service is running, and is long-running | active (running) since 2026-09-29 00:54:34 CST;ExecStart=/home/li/.local/bin/node paper.js;Restart=always | systemctl --user status mev-paper;cat mev-paper.service |
| 2 | Snapshot size and time window | 267 trades,16:55:54.244Z → 17:05:43.160Z(9 min 49 s, 600 blocks ≈ 0.98 s/block) | python3 -c "import json;...;print(min/max ts, max-min blk)" |
| 3 | Reporter-printed net (run against the frozen snapshot) | n: 267,net: 741670.47,profitFactor: '1457.30',winPct: '29.6' | Copy the 267 frozen lines as trades.jsonl, then run node report.js |
| 4 | Real net (after removing 2 outliers) | −$376.26(265 trades) | Filter abs(net)>1000 then sum |
| 5 | Combined gross of the 2 fake fills | $742,048.94 | Take the two rows with gross > 1000 and sum |
| 6 | Ratio of fake price to real market price | 33000.10650784375 / 88.713 = 372.0 | node -e "fetch(info,allMids)" take @107 |
| 7 | REST allMids channel is normal | has @107: true;value @107: 88.713 | Same as above; note the return is a string |
| 8 | WS subscription field name is wrong | channel=error ... "type\":\"orderBook\"... | Send {type:'orderBook',coin:'@107'} to wss://api.hyperliquid.xyz/ws |
| 9 | The correct subscription name yields an order book | BID=88.724 ASK=88.739 mid=88.7315 | Same as above, change to {type:'l2Book'} |
| 10 | WS handling layer structure mismatch | Code reads levels.b[0].px; real l2Book is levels[bids[],asks[]], elements {px,sz,n} | paper.js:55-56;wsprobe4.mjs prints keys |
| 11 | mid=? is a display bug, not an input failure | "88.713".toFixed?.(4) ?? '?' → ?;88.713.toFixed(4) → 88.7130 | Reproduce with node -e. The criterion is “was a number ever printed” rather than a count: grep -cE 'mid=[0-9]' paper-stdout.log = 0 (not one heartbeat ever printed a numeric value); grep -c 'mid=?' grows with the process — 9 while writing, 25 at verification |
| 12 | S2 same-block entry/exit share and holding distribution | holdBlks==0: 92/156 = 59%; full distribution mean=10.65 median=0 max=137 | Group and count/stat by holdBlks |
| 13 | Same-block group gross and fees | gross −$2.54 / fees $201.20 / net −$203.74 | Same grouping, summed |
| 14 | Real P&L by strategy | S1: n=111 win=67.6% net=+$3.90;S2: n=154 win=1.3% net=−$380.17 | After removing outliers, group by strat |
| 15 | Fee config (explains the difference between pools) | prjxA/nest = 0.05%,kitt/prjxB = 0.30%;obTakerFeePct=0.045 | config.json |
| 16 | What the daily report would announce | title = "MEV模拟 X天:267笔 胜率29.6% 净$+741670",level = "info" | Substitute into step 4 of mev_report.py |
| 17 | That report is already registered in the scheduler | mev_report → /usr/bin/python3 /home/li/mev-monitor/mev_report.py,flock=/tmp/cron-mev-report.lock | git show 4ed2477 -- scripts/windmill_registry.json |
One self-correction (written into section 4 of the body)
On first inspection, 9 heartbeats all showing mid=? prompted the reflex conclusion “WS is down, the strategy has no price input”. Following it down showed that is only half right: the WS revision channel indeed never took effect (#8, #10), but pollLoop has a REST allMids fallback and that channel is normal (#7); mid=? is a string toFixed call failing at the printing layer (#11), not missing data. The conclusion was corrected to three co-existing facts: “the slow channel is usable, the revision channel is dead, the log display is distorted”.
Unverified / in doubt
- The exact cause of 33000.10650784375 is not localized. This round I tried pulling the prjxA pool’s
eth_getLogsforblk 47131225/47131232, and the RPC returned empty (it did not give me the rawdata), so I cannot recompute field by field. In the body, section 6 states only two verified things: the price differs from the real market price at the same moment by 372x; and no sanity check exists in the code segment that produced it. Mechanism undetermined, gap confirmed — not written up as a verified conclusion. - Connected uncertainty from that: the
grossof the above two trades (combined $742,048.94) is the arithmetic result of an erroneous input, not a real trading opportunity. The article’s attribution of “where the 741k came from” stops at “2 outliers + 1 wrong price” and does not speculate further on the specific parse path. paper.js’s stderr at startup has 3 lines of/usr/bin/env: 'node': No such file or directory, while the current service runs fine and/usr/bin/nodedoes not exist. It may be left over from a past start via shebang/env node; it did not affect the current run and was not investigated.- The snapshot is only 267 trades / 10 minutes, so any conclusion about “long-term strategy expectancy” does not hold. All strategy assessments in the article are scoped to this window.
How to re-run
| |